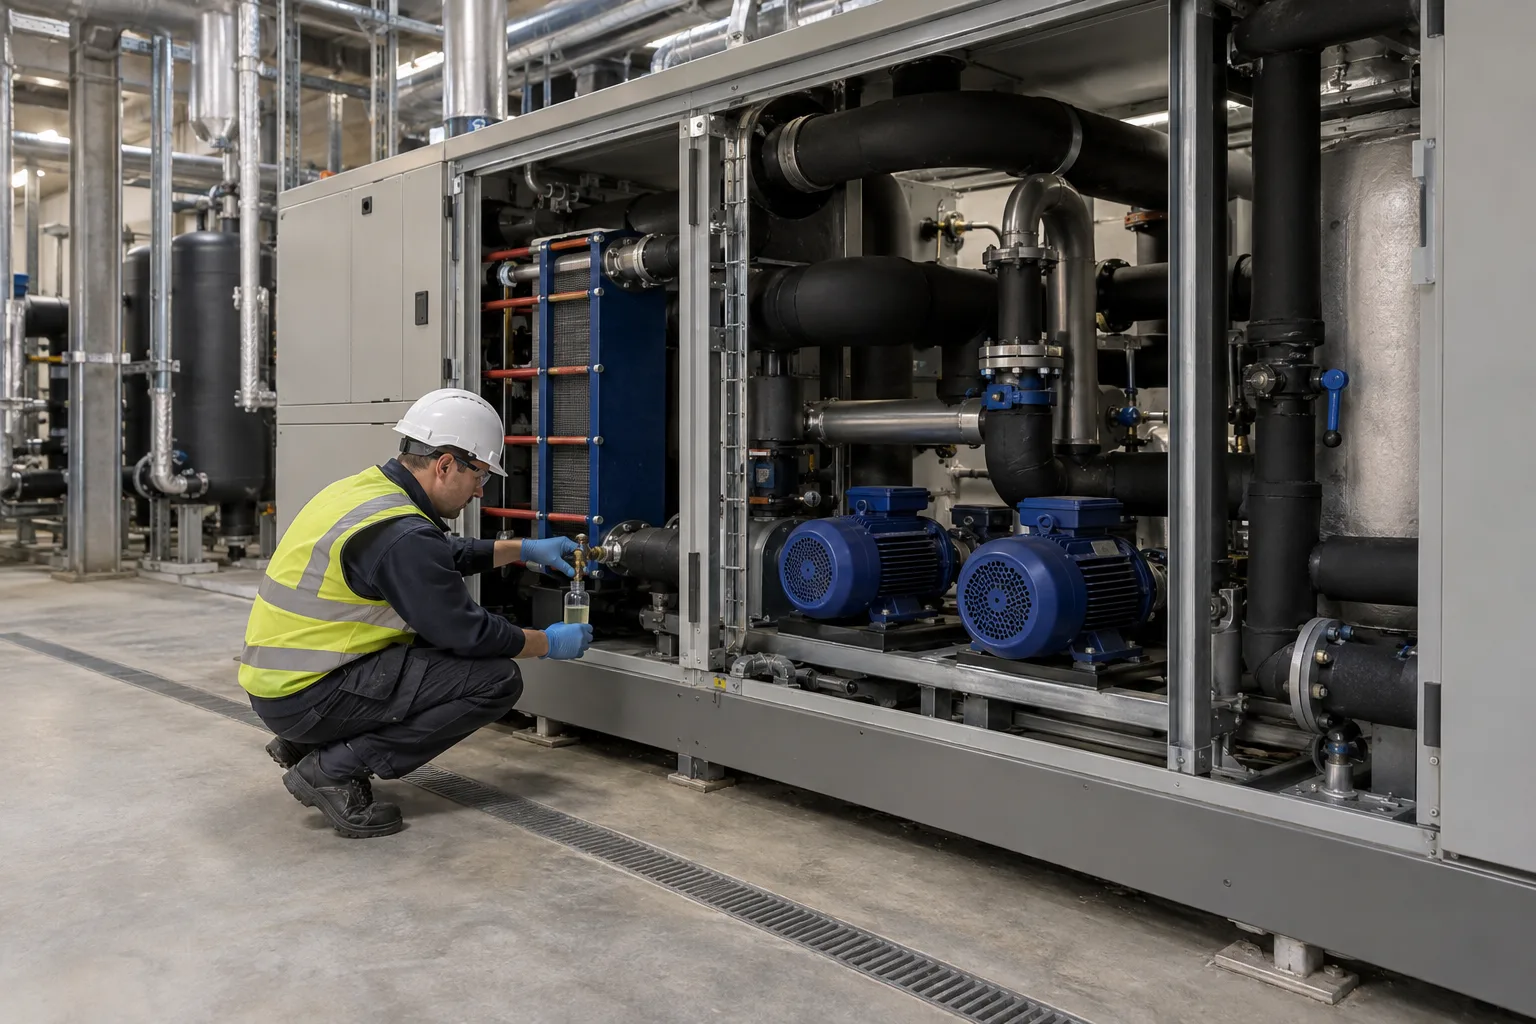
A direct-to-chip cooling loop runs on inhibited propylene glycol that has to stay clean, correctly diluted and chemically protective for years. Lab analysis tells you how it looked on the day the sample was drawn. Inline sensors fill the gaps between those days. The Open Compute Project’s PG25 guidelines (version 1.0.0, September 2026) name five inline measurements for a technology cooling system (TCS), and each one answers a different question about the fluid. This guide takes them in turn: what each sensor detects, where its readings stop being useful, and how to set the limits that turn a trend into an alarm.
The five inline measurements for PG25 coolant
| Measurement | What it detects | Sensor type in the OCP guidelines |
|---|---|---|
| pH | Degradation, contamination, inhibitor depletion | Gel-filled or solid-state pH probe with ATC, rated for glycol and water |
| Refractive index | Glycol concentration and dilution | Digital refractometer with ATC |
| Electrical conductivity | Ionic content, severe contamination, over-dilution | Conductivity probe with ATC |
| Turbidity | Particles, corrosion products, microbial growth | Optical IR or LED sensor with ATC |
| Corrosion rate | Metal loss in the loop | ER, inductive resistance, electrochemical noise or LPR probe |
The guidelines link inline monitoring directly to sampling effort. A loop with pH and refractive index measured inline, wetted materials confirmed compatible and a team familiar with the fluid is treated as low risk: lab analysis at commissioning and once a year. Without inline monitoring and with an unfamiliar fluid, the suggested lab interval for the first eighteen months is every six months, with on-site testing on the same cycle.
pH: the early warning
pH responds first to most of what goes wrong in an inhibited fluid. The guidelines give typical values of 8.0 to 10.5 for conventional inhibitors and 7.0 to 10.5 for OAT-based fluids, and the band for a given loop comes from its fluid supplier. pH probes have a cost: glycol and additives coat the membrane, and inline glass electrodes drift and wear faster in glycol than in water.
Our separate guide to data center pH monitoring covers probe placement in a CDU loop, the size of the temperature effect at loop temperatures, and calibration over Modbus with the PH-110 industrial pH probe.
Glycol concentration: refractive index
Glycol concentration is the one number that keeps the loop biologically stable. The guidelines warn that bio-growth becomes possible when propylene glycol falls below about 25%, and they set the in-use window for PG25 at 24 to 29% by volume. Over-dilution can happen at commissioning, when flush water is left in the system, and later through top-ups with plain water.
The recommended inline instrument is a digital refractometer with temperature compensation. The guidelines give an example limit of 1.362 to 1.368 refractive index at 20°C for 24 to 29% glycol, with an important caveat: inhibitors and additives change the refractive index, so the correlation between index and concentration differs between fluid manufacturers. Every reading has to be read against the published curve for the specific fluid in the loop. When the value leaves its band, the guidelines’ next step is a handheld refractometer, then a concentration adjustment under the fluid supplier’s direction.
Conductivity: a trend, not a diagnosis
Conductivity tracks the total ionic content of the fluid. In an inhibited glycol coolant it is largely set by the formulation and its ionic additives, which is why PG25 conducts far more than the high-purity water used to flush the loop, which the guidelines limit to under 25 µS/cm. The OCP guidelines give 1,000 to 10,000 µS/cm as an example operating range, and they are direct about the limits of the measurement: conductivity does not identify a contaminant, significant changes in additives or dissolved metals may not move it much, and the value is best used as a proxy and a trend.
Two details decide whether a conductivity sensor works in this fluid:
- Range at the hottest point. Conductivity rises with temperature, and the guidelines ask that the sensor’s range cover the value at the loop’s maximum operating temperature, with a buffer for the gradual rise as fluid ages.
- Cell constant. A conductivity cell is built for a band. The EC-100 conductivity probe with the K=1.0 cell reads 2 to 10,000 µS/cm at ±1.0% of full scale, with automatic temperature compensation from 0 to 60°C, over RS485 Modbus RTU. That fits a coolant that runs in the low thousands of µS/cm. A fluid whose conductivity sits near 10,000 µS/cm at loop temperature needs the K=10.0 cell, which covers 20 to 100,000 µS/cm.
The guidelines’ action rule is simple: if the value moves more than 20% from its baseline, or changes sharply in a short period, validate it with a handheld or benchtop meter or send a sample to a lab. After any change to the fluid, re-zero the baseline.
Turbidity: a supporting indicator
Turbidity measures cloudiness, which can come from particles, corrosion products, microbial growth or scale. The guidelines treat it as supporting evidence in glycol loops rather than a primary measurement: it will not catch minor fouling, it says nothing about particle size, and dyes, additives and air bubbles all affect the reading. Where it is used, they recommend an optical sensor with an infrared or LED source and warn against colorimetric meters, since the fluid’s dye distorts color-based readings. The example limit is under 10 NTU, with any shift of more than 5 NTU from baseline validated before acting on it.
Corrosion rate: the direct measurement
The other four measurements describe the fluid. A corrosion probe measures what the fluid is doing to metal. The guidelines list electrical resistance, inductive resistance, electrochemical noise and linear polarization resistance (LPR) probes, each with different response speed and stability. Our guide to corrosion monitoring in data center liquid cooling loops covers the acceptance limits for copper and stainless steel and where an online corrosion rate sensor fits.
How to set operating limits for coolant sensors
Limits are what turn five trend lines into a monitoring system. The guidelines’ method has three steps:
- Record a baseline at first fill. When the loop is filled with fresh, properly mixed fluid, the first stable readings become the reference values.
- Set upper and lower limits from the fluid manufacturer’s data or published literature, adjusted for the fluid chemistry, the operating temperature and how critical the system is.
- Review the limits once a year and after any major change, such as a fluid replacement or new hardware.
Example limits and actions from the guidelines, which they label as examples to be replaced with the fluid supplier’s numbers:
| Parameter | Example limit | When outside the limit |
|---|---|---|
| pH | 8.0 to 10.5 (conventional), 6.5 to 9.5 (OAT or hybrid) | Confirm with a calibrated handheld meter or strips, then send a sample to a lab |
| Refractive index at 20°C | 1.362 to 1.368 (24 to 29% PG) | Confirm with a handheld refractometer, then adjust concentration or send a sample |
| Conductivity | 1,000 to 10,000 µS/cm | Validate if the value moves more than 20% from baseline |
| Turbidity | Under 10 NTU | Validate if the value moves more than 5 NTU from baseline |
Reading the sensors together
A single sensor reports a number. Two or three together start to suggest a cause, which is what tells you whom to call. These patterns follow from what each measurement responds to, and every one of them still ends in a sample to confirm:
- Glycol concentration and conductivity both fall, pH steady. The fluid has been diluted, most often with water at a top-up or by flush water left after maintenance.
- pH falls over weeks, glycol steady. The inhibitor package is being consumed or the fluid is degrading. This is the case the annual lab test for reserve alkalinity and degradation acids exists for.
- Conductivity jumps, turbidity rises. Something entered the loop: a cleaning chemical, an incompatible fluid or corrosion products.
- Corrosion rate rises while the fluid readings look normal. Look at the metallurgy and galvanic couples before the chemistry.
Getting coolant sensor data into the BMS
The guidelines recommend integrating sensor readings with the BMS for automated alerts and control, and sharing the trend with the fluid supplier to compare against lab data. In practice there are two ways in:
- RS485 Modbus RTU into a CDU controller or BMS gateway that polls the sensors. Several probes share one two-wire bus at different addresses, and calibration commands use the same line. The PH-110 (RS485 version) and EC-100 both use 9600 baud, 8N1, default address 1.
- 4-20 mA into an analog input card, for controllers without a Modbus master. The PH-110 is available with a 4-20 mA output.
Whichever route, store the temperature beside every reading. pH, conductivity and refractive index all move with temperature, and comparing values taken at different loop temperatures produces trends that are not there. Where no controller is available, such as a pilot loop, the Omni Genesis controller reads RS485 sensors directly and logs them to a cloud dashboard.
Inline sensors do not replace the lab. The guidelines still recommend a full lab analysis of every TCS loop at least once a year, covering glycol concentration, pH, reserve alkalinity, inhibitors, chloride, sulfate, hardness, degradation acids and dissolved metals. What the sensors add is the time between samples. If you are specifying coolant monitoring for a CDU or a TCS loop, tell us the fluid, the loop temperature range and the controller, and we will put the sensor package together with you.