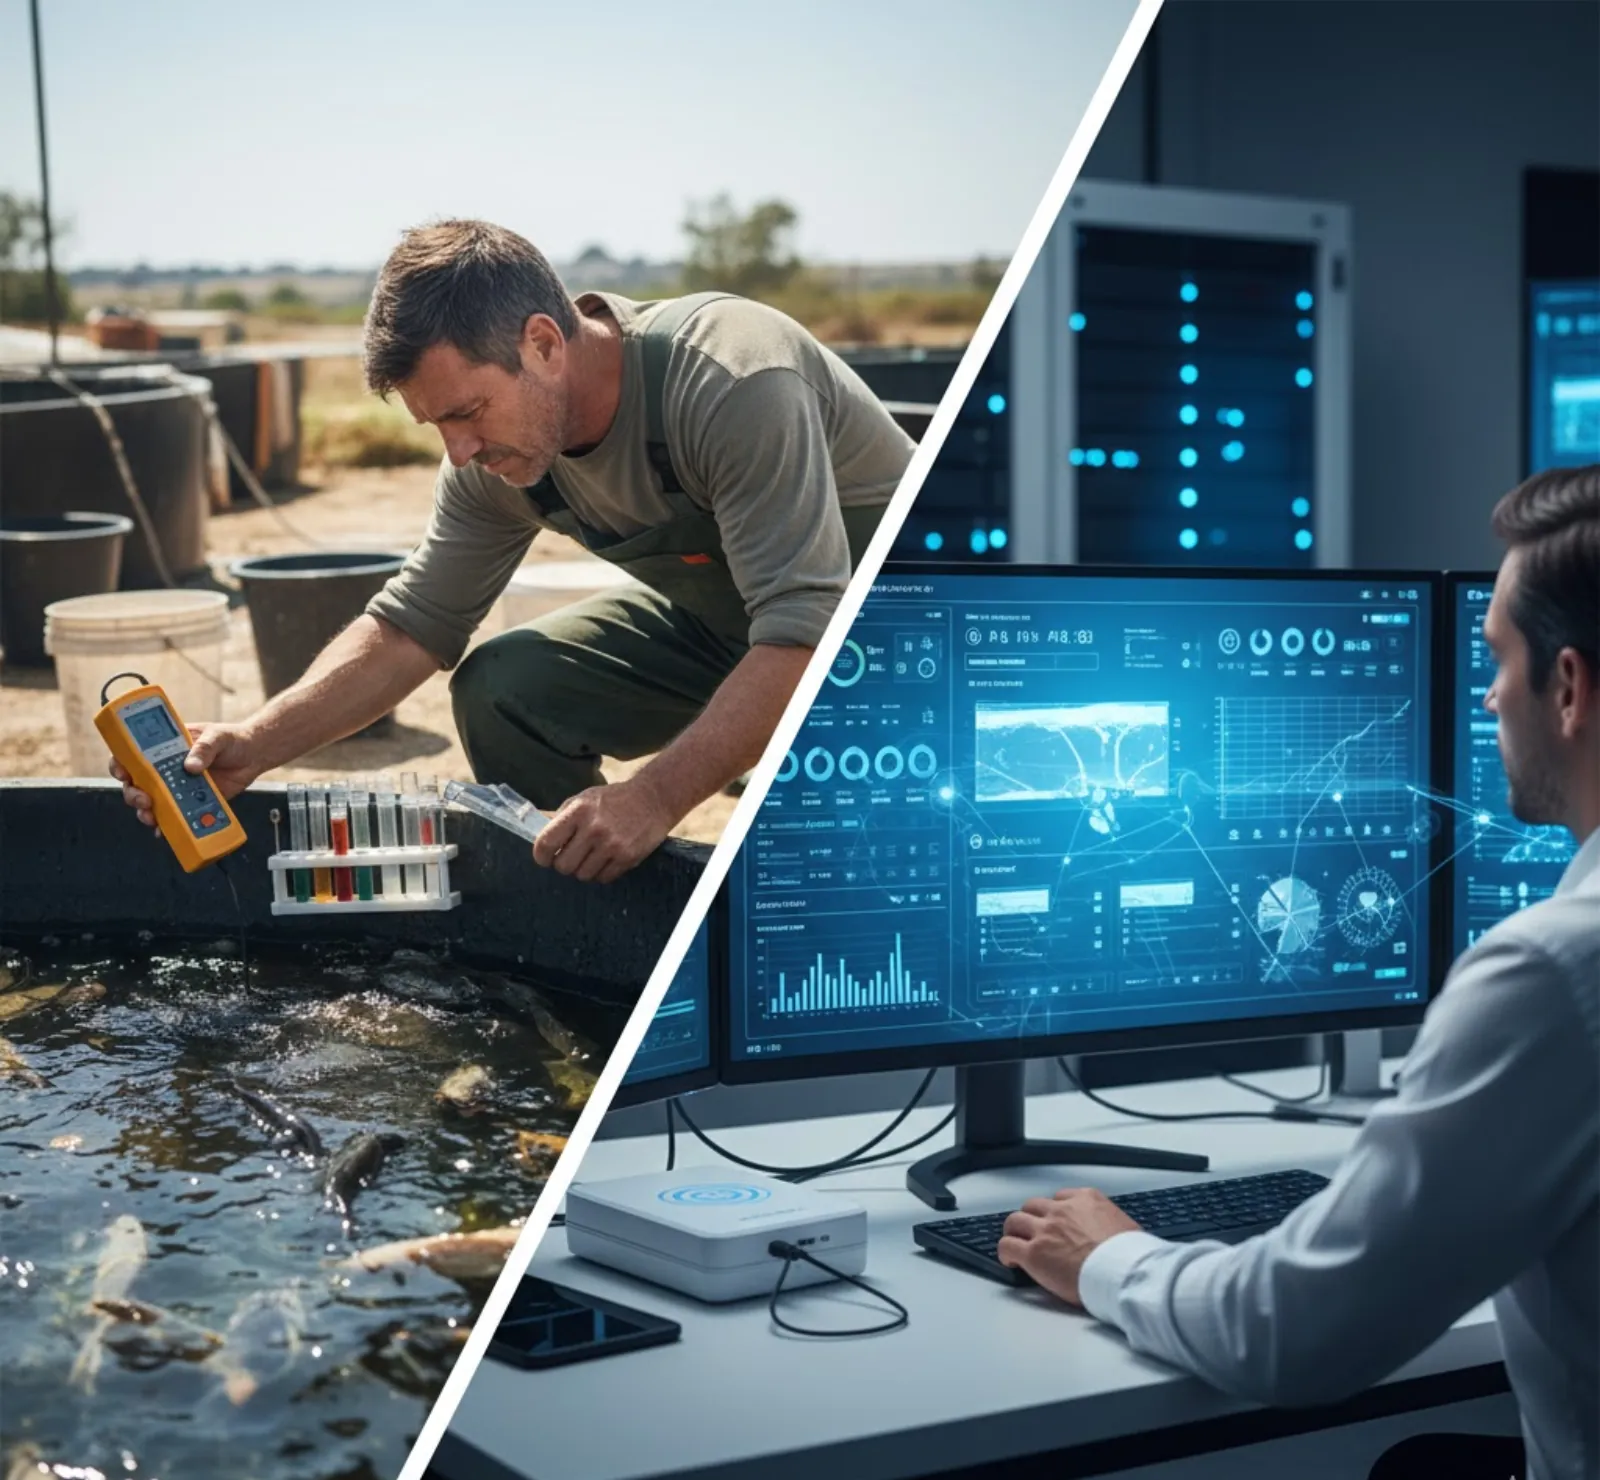
We’ve had the same conversation with maybe fifty farm managers over the past few years. It always starts the same way: “We’ve been doing manual testing for years and it works fine.” And we get it. Manual testing does work, right up until it doesn’t. The problem is that you rarely find out it stopped working until you’re staring at a pond full of dead fish at 6 AM, doing the math on how much stock just floated belly-up.
This post isn’t a sales pitch disguised as analysis. We’re going to walk through where the real costs of manual testing hide: the labor it consumes, the information gaps it leaves, and the losses it fails to catch. And then you can draw your own conclusions about IoT aquaculture monitoring ROI. We’ll even tell you when manual testing still makes perfect sense. But we think if you’re honest with yourself about what manual testing actually costs you, the answer is going to be pretty clear.
The 3 AM Problem
Here’s the fundamental issue with manual water testing: it’s a snapshot. You test dissolved oxygen at 8 AM and 4 PM, and you get two data points in a 24-hour period. What happened at 3 AM? You have no idea.
And 3 AM is exactly when things go wrong. That’s when algal respiration peaks and dissolved oxygen bottoms out. That’s when equipment failures go unnoticed for hours. That’s when a sudden temperature shift from a cold front can crash your DO levels from 6 mg/L to 2 mg/L in ninety minutes.
If you’ve been in aquaculture long enough, you know someone who’s lost a crop overnight. Maybe you are that someone. We certainly have. We talked about it in our aquaculture water quality guide. The fish don’t care that your testing schedule says the next check is at 7 AM.
So when we compare manual vs automated water testing, we’re not just comparing measurement methods. We’re comparing a system with built-in blind spots against one with continuous visibility. That distinction matters a lot when we get to the return.
The True Cost of Manual Testing
Most farm managers know what they spend on test kits and handheld meters. What they usually underestimate is the labor cost, and what they almost never account for is the cost of information gaps.
Labor Cost
Let’s build this out honestly. A typical aquaculture operation monitors at minimum five parameters: dissolved oxygen, pH, temperature, ammonia, and either salinity (marine/brackish) or electrical conductivity (freshwater). Each parameter takes 15 to 30 minutes per test point when you factor in walking to the pond, taking the sample, running the test, recording the result, and cleaning up.
For simplicity, let’s call it 20 minutes per parameter per location.
Daily testing time for a single pond:
- 5 parameters x 20 minutes = ~100 minutes per test round
- 2 tests per day (morning and afternoon) = 200 minutes = 3.3 hours
- If you add a third test during critical periods (summer, high stocking density): 5 hours/day
Annual labor for a single pond (2 tests/day):
- 3.3 hours/day x 365 days = 1,205 hours/year
That is roughly 150 full working days. For a single pond. A five-pond operation at the same testing frequency would consume the entire working year of more than one full-time employee, doing nothing but water testing.
Now, in practice you can be more efficient than this. An experienced tech can batch-test multiple ponds in a circuit, and some parameters are faster than others. Even when you cut the figure generously for batching efficiency, a five-pond operation still ties up the equivalent of a full-time employee whose entire job is walking from pond to pond with test kits.
That person could be feeding, grading, maintaining equipment, or managing the business. Instead they are running colorimetric tests. The labor is not free just because it is already on payroll. It is labor you cannot redeploy.
And here’s the thing nobody plans for: weekends and holidays. Water quality doesn’t take Christmas off. Either you’re paying overtime, or you’re skipping tests, or you’re doing it yourself when you should be taking a break. Based on our experience working with farm operators, weekend and holiday coverage adds a meaningful slice on top of the everyday labor, and it is the slice most operations quietly drop, precisely when the risk is highest.
Reagent and Equipment Costs
Manual testing consumables are a recurring drain, and they add up:
- pH test kits: Replaced every 50-100 tests. At 2 tests/day, that’s a new kit roughly every month, every month, for every pond.
- Ammonia test kits: Similar replacement rate. Another monthly line item per pond.
- DO meter membranes and electrolyte: If you’re using a handheld DO meter, membrane caps and electrolyte need replacement every 3-6 months.
- Calibration solutions: pH buffers and DO calibration standards, replaced on a rolling basis.
- Refractometer (saltwater): Modest upfront cost, minimal ongoing cost.
The point is not any single line item. It is that manual testing consumables never stop arriving. Every pond, every month, you are buying reagents that get used up and thrown away. Across a five-pond freshwater operation that is a steady, permanent outflow you can never switch off.
If you want a multi-parameter handheld meter instead of individual test kits, the upfront cost is higher but the per-test cost is lower. Either way, the consumables keep coming.
Hidden Costs
This is where the manual vs automated water testing comparison gets uncomfortable.
Human error. Color-matching reagent tests are subjective. We’ve seen two experienced techs read the same ammonia test and get different results. Handheld meters drift between calibrations. Readings taken in direct sunlight are unreliable. One industry survey we’ve seen referenced suggested that manual colorimetric tests can carry error margins of 10-20%, which is significant when you’re trying to detect early warning signs of a water quality problem.
No continuous data history. A notebook full of handwritten readings is not a dataset. You can’t run trend analysis on a clipboard. You can’t see that your DO has been declining by 0.1 mg/L every day for the past two weeks, a pattern that’s invisible in daily spot-checks but obvious in a continuous data log.
No alerts. This is the 3 AM problem again. Manual testing gives you data only when someone is actively testing. The other 20+ hours of the day, you’re flying blind. If your aerator fails at midnight, you won’t know until morning.
Decision delay. With manual testing, there’s always a gap between “something changed” and “we know about it.” That gap might be hours. In aquaculture, hours matter.
The True Cost of IoT Monitoring
Now let’s be equally honest about going digital. IoT monitoring isn’t free, and we don’t want to pretend otherwise.
Hardware Investment
Here are real system configurations from our current catalog. The hardware investment is a one-time purchase: you buy it once and it works for years, unlike consumables that you keep rebuying.
Basic Freshwater Setup (single pond): Right-sized for farms monitoring the critical basics.
| Component | Details |
|---|---|
| DO-P100 dissolved oxygen sensor | PE body, fluorescent, freshwater optimized |
| PH-10 pH sensor | Analog, +-0.01 pH accuracy |
| EC-100 conductivity sensor | K=1.0, freshwater range |
| Omni Genesis controller | 4 sensor ports, RS-485/Modbus |
Standard Freshwater Setup (single pond): More robust sensors and additional ORP monitoring.
| Component | Details |
|---|---|
| DO-100 dissolved oxygen sensor | 316L stainless, fluorescent, 1-year warranty |
| PH-100 pH sensor | Digital RS485, ATC |
| EC-100 conductivity sensor | K=1.0, freshwater range |
| ORP-100 sensor | +-1 mV accuracy, ATC |
| Omni Genesis controller | 4 sensor ports, RS-485/Modbus |
Full Marine/Saltwater Setup (single pond): Seawater-rated sensors for harsh marine environments. Ammonia is tested by kit, because ion-selective probes work in freshwater only.
| Component | Details |
|---|---|
| DO-110 titanium dissolved oxygen sensor | Titanium alloy, 0-60 ppt salinity |
| PH-110 pH sensor | Seawater pH, digital RS485 |
| EC-110 conductivity sensor | Seawater EC and salinity, 0 to 200 mS/cm |
| ORP-110 sensor | Seawater ORP, digital RS485 |
| Omni Exodus controller | 6 ports, marine-grade connectors |
Contact us for current pricing on any of these configurations. No hidden fees, no required software subscriptions for basic functionality.
Ongoing Costs
Hardware isn’t entirely a one-time expense. Here’s what to plan for over time:
- Calibration supplies: pH buffers and DO calibration solutions, used periodically.
- DO sensor membrane caps: Replacement every 6-12 months depending on conditions.
- Cellular connectivity: If you’re using 4G/LTE for remote data transmission (common for ponds away from WiFi), there’s a modest recurring data charge.
- Sensor replacement reserves: All DO sensors carry a 1-year warranty. Plan for potential replacement or membrane cap swaps after that period. pH sensors generally need replacement every 2-3 years. EC and ORP sensors can last 3-5 years with proper maintenance.
The honest comparison: the ongoing costs of IoT monitoring are modest, predictable, and roughly in the same territory as the consumables you were already buying for manual testing. The difference is that those ongoing costs do not include any labor. The labor is what manual testing keeps charging you, and the labor is what IoT monitoring frees up.
What You Get
Here’s what changes when you move to continuous IoT monitoring:
- Readings every 5-15 minutes, 24 hours a day, 365 days a year. That’s 96-288 data points per parameter per day, versus 2-3 with manual testing.
- Instant SMS and email alerts when any parameter crosses your thresholds. The 3 AM DO crash triggers your phone alarm before the fish even start showing stress.
- Historical data logging with trend visualization. You can see patterns over days, weeks, and seasons. You can correlate DO drops with feeding times, temperature changes, or stocking density.
- Remote access from your phone or laptop. Check on your ponds from home, from a supplier meeting, from vacation.
All sensors in our lineup use RS485 Modbus RTU protocol with IP68 waterproof ratings. They’re designed for permanent submersion in aquaculture environments, not lab instruments adapted for field use. For more on sensor communication protocols and why RS485 matters for reliability, see our sensor protocols guide.
Side-by-Side: The Real Comparison Over Three Years
This is the comparison that tells the real story. Let’s look at a single pond over three years and stack the two approaches against each other.
Manual Testing Over Three Years (Single Pond)
Across three years, a single pond on a twice-daily testing schedule consumes:
- Labor every single day: roughly 3.3 hours, 365 days a year, three years running. That labor is fixed. It does not go down with experience, and it does not pause.
- Consumables that never stop: test kits replaced monthly, membranes and electrolyte every few months, calibration standards on a rolling basis. Every pond, every month, for three years.
- Handheld meter wear: meters drift, get dropped, and need replacing.
- Weekend and holiday coverage: either overtime, or skipped tests, every weekend and every holiday for three years.
None of these costs ever stop. They are the same in year three as in year one, because manual testing has no economies of scale. The bill simply keeps arriving.
IoT Monitoring Over Three Years (Single Pond, Standard Freshwater)
Across the same three years, an IoT monitoring station consumes:
- One hardware purchase, up front. Contact us for current pricing on the standard freshwater setup.
- Calibration and membrane replacements, periodically.
- Cellular connectivity, a modest recurring data charge.
- A sensor replacement reserve, set aside for swaps after the warranty period.
The shape of the IoT cost is fundamentally different. It is front-loaded into one hardware purchase, and after that the ongoing costs are small and predictable. Crucially, none of the IoT ongoing costs is labor. The system reads your water for you, 24 hours a day, for those three years.
So the comparison is not really number against number. It is shape against shape. Manual testing is a permanent, daily labor drain that never tapers. IoT monitoring is one investment followed by light upkeep. Even if you argue your testing labor is worth very little because you are the owner doing it yourself, the moment you value your own time at anything above zero, the continuous-monitoring side wins, because the IoT ongoing costs sit roughly level with manual-testing consumables alone, before a single hour of labor is counted.
And we haven’t even talked about the biggest factor yet.
The Mortality Factor: Where IoT Pays for Itself
All the comparisons above are about operational effort. But the real IoT aquaculture monitoring ROI calculation has to include the thing that makes or breaks aquaculture profitability: keeping your animals alive.
The Logic of Mortality
Industry figures on aquaculture mortality vary widely by species, system type, and management quality. But here are some commonly referenced ranges based on industry experience and published aquaculture management literature:
- Typical mortality in well-managed manual operations: 15-30% over a full crop cycle
- Typical mortality in operations with continuous monitoring and alerts: Potentially 5-15% lower than equivalent manual operations
That “5-15% lower” range might sound modest, but think about what it means. Every percentage point of mortality you avoid is fish or shrimp that reach harvest weight and earn revenue instead of being scooped out dead. On a stocked pond, a few percentage points of survival is a meaningful number of additional animals sold per cycle, every cycle, on every pond you monitor.
Freshwater example, tilapia pond: A pond stocked with 10,000 fingerlings, grown to a target harvest weight. If your baseline mortality is 25% under manual testing and continuous monitoring brings it to 20%, that is 500 extra fish surviving to harvest from that one pond, in that one cycle. Run two cycles a year across five ponds and the additional surviving stock compounds quickly, every year, purely from earlier detection of problems.
Saltwater example, shrimp intensive pond: A half-hectare pond stocked at 100 PL/m2 holds 500,000 post-larvae. Shrimp mortality is typically higher than fish, and shrimp crash faster. A 5% improvement in survival on a pond that size is a large number of additional animals reaching harvest. Across a 10-pond operation running two to three cycles a year, the recovered stock is substantial.
And that’s the conservative scenario, just a 5% mortality reduction. The real value of IoT monitoring isn’t only reducing average mortality by a few percentage points. It’s preventing the catastrophic events: the overnight DO crash that kills 80% of a pond, the ammonia spike after a biofilter failure, the temperature shock from an unexpected storm.
One Catastrophic Event
Let us put it bluntly: one overnight DO crash can wipe out most of a shrimp pond, and a full pond of harvest-ready shrimp is one of the most valuable things on the farm. An Omni Exodus controller with a DO-110 titanium sensor would have sent you an SMS alert within 15 minutes of DO starting to drop. You could have had emergency aeration running in under an hour. Instead, you discovered dead shrimp at 6 AM.
The entire marine monitoring system pays for itself the first time it catches a problem that would otherwise have cost you a meaningful share of a single pond’s crop. In shrimp farming, that is not a hypothetical. It is a question of when.
Freshwater Farm Example: Tilapia Pond Operation
Let’s walk through a complete scenario for a mid-size freshwater operation.
Farm profile:
- 5 one-hectare earthen ponds
- Tilapia, semi-intensive culture
- 2 crop cycles per year
- Location: Southeastern US (or similar tropical/subtropical climate)
Manual Testing Scenario
- Staffing: 1 dedicated water quality technician, effectively a full-time hire
- Testing frequency: 2 rounds per day, all 5 ponds, 5 parameters each
- Equipment: 1 handheld DO meter, 1 pH meter, assorted test kits
- Annual supplies: reagents, membranes, calibration solutions, replaced on a rolling basis
- Weekend coverage: the technician gets weekends off, so the owner does abbreviated testing, spending owner time that should have gone elsewhere
The defining feature of this scenario is that a full person’s working year is consumed by water testing, every year, with no end. That person never becomes available for higher-value work, because the testing schedule never lets up.
IoT Monitoring Scenario
- Hardware: 5x Standard Freshwater setups (contact us for current pricing)
- Ongoing costs: modest calibration, maintenance, and connectivity, year after year
You still need someone to manage the farm, of course. But that person is now spending their time on feeding, harvesting, maintenance, and business management instead of walking from pond to pond with test kits. The dedicated testing role disappears, and its working year is freed for work that actually grows the operation.
That is the real return: a full-time position’s worth of labor redirected from a repetitive, error-prone chore to the tasks that improve yield and margins. Even if you keep a part-time tech for manual spot-checks and maintenance (smart idea, and we’ll get to that), the bulk of that labor is recovered.
The Omni Genesis controller handles 4 sensors per unit, which covers the standard freshwater setup (DO, pH, EC, ORP). If you want to add an ammonium sensor or chlorophyll sensor for algae bloom monitoring, you’d either upgrade to the Omni Exodus (6 ports) or add a second controller.
Saltwater Farm Example: Shrimp Intensive Operation
Shrimp farming is where the case for continuous monitoring gets really stark, because the stakes are higher, the environment is harsher, and the margins for error are thinner.
Farm profile:
- 10 half-hectare intensive shrimp ponds
- Pacific white shrimp (Litopenaeus vannamei)
- 2-3 crop cycles per year
- Brackish/saltwater environment
Why Shrimp Operations Need More Monitoring
Shrimp are more sensitive to water quality fluctuations than most fish species. They’re bottom dwellers in stratified ponds, so surface readings don’t tell the whole story. Disease outbreaks (EMS, white spot, vibriosis) correlate strongly with water quality stress events. And the crop values are substantially higher per hectare than most freshwater fish operations.
For shrimp, you really want to monitor:
- Dissolved oxygen (absolutely critical; shrimp crash faster than fish)
- pH (affects ammonia toxicity and shell formation)
- Salinity/EC (must be stable; fluctuations stress animals)
- ORP (indicator of overall water chemistry health)
- Ammonia by test kit in seawater (toxic at much lower concentrations than for fish); an NH4-100 probe adds trend tracking in freshwater culture
That’s the full marine setup we described earlier. And in saltwater, you need corrosion-resistant hardware. Our DO-110 uses a titanium body specifically because stainless steel corrodes too quickly in marine environments. The EC-110 covers the full seawater salinity range. And the Omni Exodus controller is marine-grade with 6 ports.
The Three-Year Picture for a 10-Pond Shrimp Farm
Manual Testing. A 10-pond intensive shrimp farm with the round-the-clock attention shrimp demand needs more than one full-time technician on water quality alone. Add the consumables for 10 ponds across 6+ parameters, handheld meter wear, and overtime or holiday coverage, and what you have is several full-time positions’ worth of effort consumed by testing, permanently, with the consumable bill arriving every month for three years straight.
IoT Monitoring. Ten Full Marine setups are one hardware purchase (contact us for pricing). After that, the ongoing costs are calibration, maintenance, connectivity, and a sensor replacement reserve: small and predictable, with no labor inside them.
Over three years the contrast is dramatic. Manual testing locks up several people’s working years and a perpetual consumables stream. IoT monitoring is one investment plus light upkeep, and the labor it frees can be redeployed onto feeding, grading, disease management, and expansion.
And again, this doesn’t include the mortality benefit. If continuous monitoring prevents even one catastrophic pond loss over three years (and in shrimp farming, overnight crashes are not rare events), the value of the recovered crop alone overshadows everything else in the comparison. For more detail on parameter management specific to shrimp operations, see our shrimp farming water quality guide.
The IoT system pays for itself rapidly through labor freed up alone on a 10-pond shrimp farm. That’s not an optimistic projection. That’s straightforward arithmetic.
When Manual Testing Still Makes Sense
We promised we’d be honest about this, and we mean it. IoT monitoring isn’t the right answer for everyone in every situation.
Very Small Operations
If you have one or two backyard ponds and you’re the only person working them, the labor comparison doesn’t apply the same way, since you’re doing the testing yourself regardless. At that scale, the Omni Genesis Lite with a single DO-P100 sensor is still worth it for the overnight alert capability alone, but the full multi-parameter setup may be harder to justify purely on financial terms.
Backup Verification
Even with IoT monitoring, smart operators do periodic manual spot-checks. Sensors can drift. Biofouling can affect readings. A weekly manual verification with a calibrated handheld meter is sensible insurance and good practice. The IoT system handles the 24/7 continuous monitoring; manual testing handles the “trust but verify” quality assurance.
Parameters Not Easily Automated
Some water quality parameters are still best tested manually or in a lab. Specific pathogen tests, detailed mineral profiles, certain heavy metals: these aren’t practical to monitor continuously with in-situ sensors. Your lab testing doesn’t go away with IoT; it just gets focused on the things that actually require lab work.
Startup Farms Testing the Concept
If you’re just getting into aquaculture and aren’t sure about your long-term commitment, starting with manual testing is reasonable. But we’d strongly suggest investing in at least a basic DO monitoring system from day one. Dissolved oxygen is the parameter most likely to kill your stock overnight, and a Genesis Lite controller with a single dissolved oxygen sensor is a far smaller commitment than losing your first crop.
The Hybrid Approach
What most successful operations end up with is a hybrid: IoT sensors for continuous monitoring of the critical parameters (DO, pH, temperature, conductivity), plus periodic manual or lab testing for everything else. The IoT system is your early warning system and data logger. Manual testing is your quality assurance cross-check.
This combination gives you the best of both worlds and is honestly what we recommend for most farms.
Beyond ROI: Data-Driven Farm Management
The financial case for IoT monitoring is compelling on its own, but the real transformation happens when you start using the data, not just collecting it.
Feed Optimization
When you can see DO levels in real time, you can optimize feeding. Heavy feeding drives DO consumption as uneaten feed decomposes and fish metabolic demand increases. By monitoring DO response to feeding events, you can fine-tune feed amounts and timing to maximize feed conversion ratios. Based on typical industry experience, even a 5-10% improvement in feed conversion on a commercial operation translates to significant savings, given that feed is usually 50-60% of total production cost.
Predictive Maintenance
Continuous data reveals patterns that spot-checks miss. A gradual decline in DO levels over weeks might indicate biofilter degradation, increasing organic load, or declining aerator efficiency. You can catch and address these trends before they become emergencies. Your afternoon DO readings looked fine at 6.2 mg/L, but the continuous data shows that your overnight minimum has been creeping down from 4.8 to 4.2 to 3.9 over the past month. That’s a trend that demands attention, and you’d never see it with manual testing.
Crop Planning
After a few crop cycles with continuous data, you build a historical picture of your farm’s water quality patterns. You know which months bring the tightest DO margins. You know how pH behaves after heavy rain events. You know how long it takes your system to recover after a feed increase. This historical data makes every subsequent crop cycle more predictable and more profitable.
Compliance Documentation
If you’re pursuing or maintaining certifications like ASC (Aquaculture Stewardship Council), BAP (Best Aquaculture Practices), or GlobalGAP, you need documented water quality records. Automated data logging with timestamped readings is dramatically more credible and less labor-intensive than handwritten notebooks. Auditors love digital records with continuous timestamps. They’re skeptical of notebooks.
Making the Transition: Start Small
You don’t need to instrument every pond with a full sensor suite on day one. Here’s a practical transition path.
Phase 1: Prove the Concept
Start with one pond, ideally your highest-value or most problematic one.
- Omni Genesis Lite controller with 1 sensor port
- One DO-P100 dissolved oxygen sensor for freshwater, or DO-110 for saltwater
This gives you 24/7 dissolved oxygen monitoring with alerts on the single most critical parameter. Run this for one crop cycle alongside your existing manual testing. Compare the data. See what the continuous monitoring catches that your twice-daily testing misses.
We can almost guarantee you’ll see overnight DO events you never knew about.
Phase 2: Expand Parameters
Once you’re convinced (and you will be), upgrade to a multi-parameter setup on that first pond:
- Move to an Omni Genesis (4 ports) or Omni Exodus (6 ports)
- Add pH, EC, and ORP sensors
- For freshwater operations, add an ammonium sensor for trend tracking, confirmed by test kit
Phase 3: Scale Across the Farm
Roll out monitoring to remaining ponds. At this point you’ll have real data from Phase 1 and 2 to justify the investment to partners, lenders, or your own planning. Many farms reallocate the labor freed up by the first ponds to fund the expansion, so the rollout effectively pays its own way.
Phase 4: Advanced Monitoring
Add specialized sensors for specific needs:
- Chlorophyll sensors for algae bloom prediction
- Ammonium ISE sensors for precise nitrogen cycle monitoring
- Additional sensor points at different depths or locations within large ponds
Conclusion: Can You Afford Not to Monitor?
Let us bring this back to what manual testing really costs you.
For a five-pond freshwater tilapia farm, manual testing consumes a full-time employee’s working year, every year, plus a consumables stream that never stops. IoT monitoring is one hardware investment followed by light upkeep, and it frees that whole working year for higher-value work. For a ten-pond shrimp operation, manual testing locks up several full-time positions; IoT monitoring recovers nearly all of that labor.
Those returns are real, and they’re conservative. We assumed efficient manual testing practices and didn’t even count the value of catastrophic loss prevention, which is where IoT monitoring delivers its most dramatic returns.
But we think the most compelling argument isn’t about the money at all. It’s about this: with manual testing, you’re making decisions based on two or three snapshots per day and hoping nothing goes wrong in between. With continuous IoT monitoring, you have complete visibility into your operation 24 hours a day, 7 days a week. You’re notified the moment something starts going wrong, not hours after it’s already gone wrong.
The question for any fish farm monitoring decision isn’t really “can I afford IoT monitoring?” A basic system with a controller and single DO sensor is a practical entry point. The real question is: “can I afford to not know what’s happening in my ponds at 3 AM?”
Based on everything above, we think the answer is pretty clear. But don’t take our word for it. Start with a Genesis Lite and a single dissolved oxygen sensor. Run it for one cycle. Let the data convince you.
It always does.
When you are ready to scale beyond that first sensor, our aquaculture monitoring system adds parameters and ponds without changing the platform. Contact us to plan the rollout.